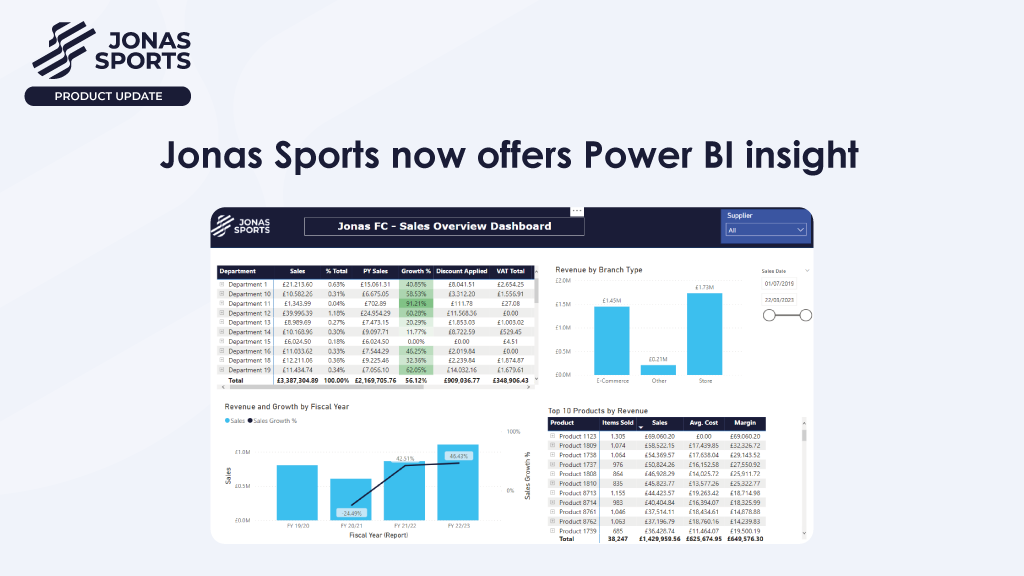
We’re now able to build custom reports for your club using PowerBI. Power BI integrates information from multiple sources to provide insights – using our in-house consultant, we have created reports that provide the insight you require to optimise your retail performance. Connected to our retail platform, you can now visualise your data. Essentially, Power BI gives you a complete overview to provide the ultimate insight which can be used for better decision-making and for creating stronger marketing campaigns.
Our standard PowerBI reports include a dashboard that highlights all of your key stats at a glance (such as revenue and growth by fiscal year, top-selling products and total sales).
We then have additional reports to cover departments, suppliers, style codes and trends (such as weekly YoY or monthly YoY). There are also weekly and matchday reports to show you how your retail sales are performing.
Of course, all of this data can be filtered and drilled down into much further detail. Do you want to know the top-selling item at the last home match? No problem.
We’ve always offered PowerBI via our Sports Data Hub solution (as seen in action at Bolton Wanderers), but now we have retail specific reports ready for you to use.
If you’re interested in getting more out of your data, please get in touch.