Our solution delivers dynamic, fully customisable dashboards that give you a real-time view of your performance. Whether you’re tracking matchday sales, analysing year-on-year growth, or identifying emerging trends across products and channels, everything you need is in one place.

Drill down into specific data points, compare historical performance, and build tailored reports that align with your business goals. From high-level overviews to granular sales breakdowns, every insight is interactive and actionable, so you can make informed decisions faster.
With everything visualised through the robust capabilities of Power BI, you can transform raw data into strategic intelligence, and turn every report into a competitive advantage.
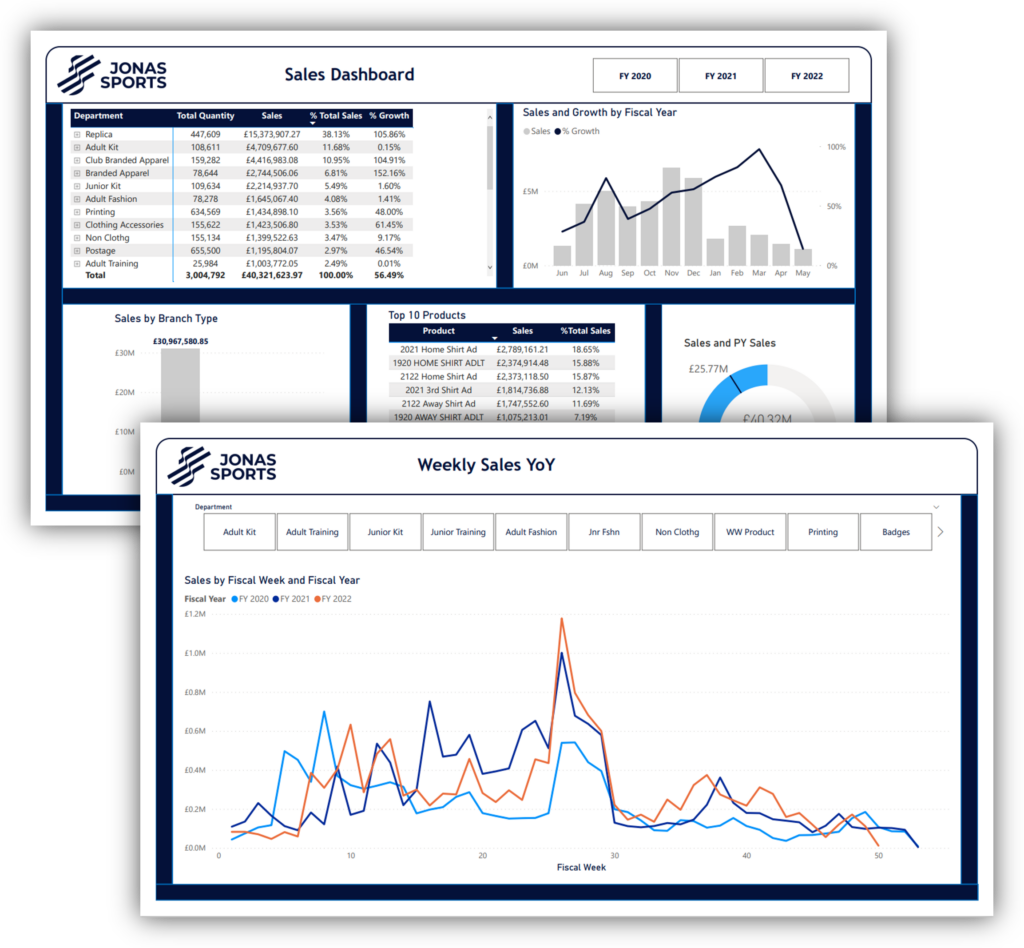
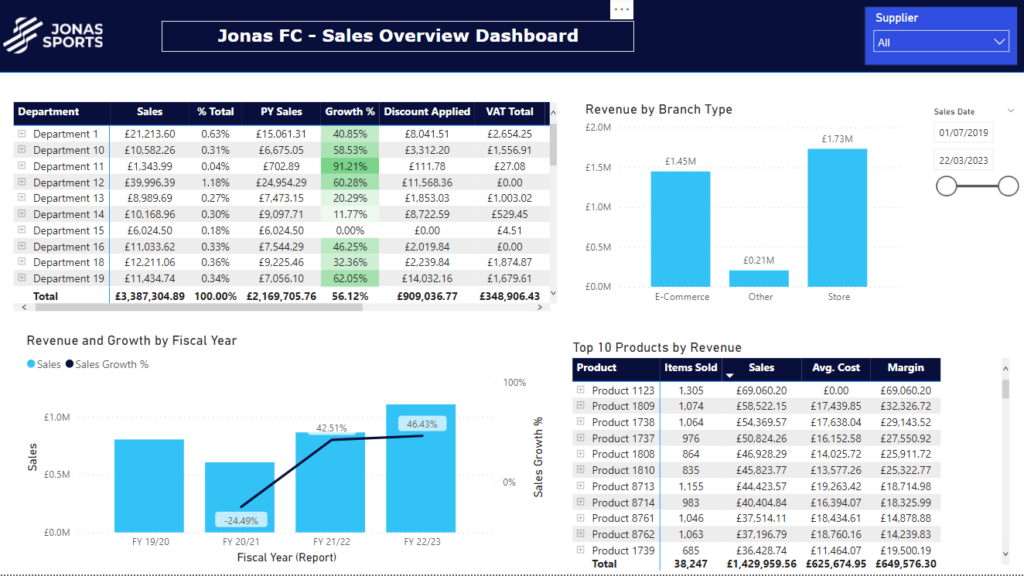
Our standard Power BI reports give you a clear snapshot of key metrics, including revenue, growth by fiscal year, top products, and total sales, all in one place. Additional reports cover performance by department, supplier, and product style, along with weekly and matchday sales trends. Quickly compare year-on-year data and track performance with ease.
Discover how our Power BI dashboards can unlock your business’s full potential.